A Censual-Cartographic Analysis of Khamis M. Population Distribution: Interpreting Asir Census Buru Report, 1431H
Fatemah mohmmad Fayez
King khalid University || KSA
Tab title
GIS occupies a prominent place in the geographical arena. Has helped technical development in the field of cartography, One of those is to organize in the representation of natural and human geographical phenomena and to clarify the spatial relationships between those phenomena in a template A beautiful artistic and technical concept and style that is easy to understand. In some sources, this type of map is called statistical maps Due to the nature of the data and the quantitative methods that cartography depends on in its production. This study deals with the statistical data of the population in Khamis Mushait, and it was represented in some considerations on four maps This study was followed in its presentation and analysis of the four approaches (critical, analytical, experimental and applied). The study presented the definition of quantitative maps, their importance, the foundations of their classification, their types, the foundations of their construction and the methods of representation Al Cartography that you use, as the study dealt with quantitative maps in geographic information systems, and reviewed the most important The programs available for producing electronic maps are the most suitable and widely used types of representation symbols for representing geographical data Phenomena in every map. The study presented the applied steps used in producing quantitative maps in geographic information systems on population maps in Khamis Mushait governorate. The study also dealt with an inventory of the contents of the maps, their evaluation, analysis and classification in descending order according to the statistical data made available to the researcher. The problem of the study emerged in the lack of awareness of the vital role of geographic information systems and their various programs in producing maps Quantitative, and some reluctance to use and activate methods of location analysis on GIS maps and its various sources in the representation of phenomena on quantitative maps. The study found the importance of quantitative maps in geographic information systems and their high capabilities in producing and dealing with maps, the variation in their fields of display and the ease of application despite the lack of a number of graphical tools that can be applied in traditional methods and the need to link them, the limited use of GIS programs despite their cognitive importance and role. In building awareness of the place and the possibility of expanding its use, in addition to the need for the user and recipient of the map to have high skill and cognitive awareness sufficient to read and correctly interpret the components of the treasure and simulate reality. The study concluded with the results and recommendations. Keywords: for quantitative maps – geographic information systems – cartographic representation methods
تحليل الخريطة الكمية بتطبيق نظم المعلومات الجغرافية GIS:
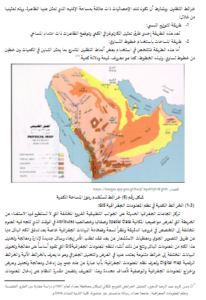
دراسة تطبيقية على خريطة توزيع السكان بمحافظة خميس مشيط – وفق تقرير هيئة الإحصاء – لمنطقة عسير لعام 1431هـ
فاطمة محمد فائز
جامعة الملك خالد || المملكة العربية السعودية
Tab title
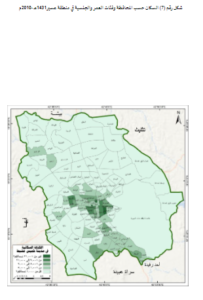
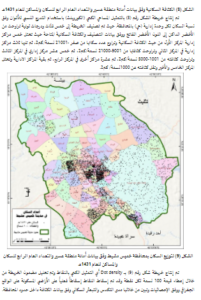
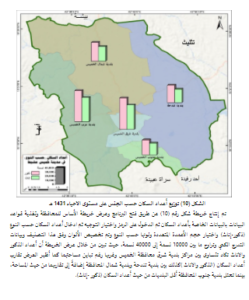
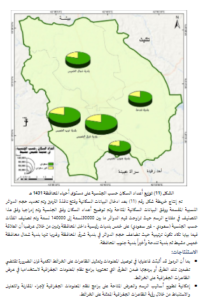
تحتل نظم المعلومات الجغرافية GIS مكانه بارزة في الساحة الجغرافية. وقد ساعد التطور التقني في مجال رسم الخرائط من تلك النظم في تمثيل الظواهر الجغرافية الطبيعية والبشرية وتوضيح العلاقات المكانية بين تلك الظاهرات في قالب مفهوم وبأسلوب فني وتقني جميل يسهل فهمه، ويسمى هذا النوع من الخرائط في بعض المصادر بالخرائط الإحصائية نظراً لطبيعة البيانات والأساليب الكمية التي يعتمد عليها الكارتوغرافي في إنتاجها. وتناولت هذه الدراسة البيانات الإحصائية للسكان بخميس مشيط وتم تمثيلها وفق بعض الاعتبارات على أربع خرائط وأتبعت هذه الدراسة في عرضها وتحليلها المناهج الأربع (النقدي والتحليلي والتجريبي والتطبيقي) وعرضت الدراسة تعريف الخرائط الكمية وأهميتها وأسس تصنيفها، وأنواعها، وأسس بنائها وأساليب التمثيل الكارتوغرافية التي تستخدمها، كما تناولت الدراسة الخرائط الكمية في نظم المعلومات الجغرافية، واستعرضت أهم البرامج المتاحة لإنتاج الخرائط الإلكترونية وأكثر أنواع رموز التمثيل ملائمةً واستخداماً لتمثيل البيانات الجغرافية للظاهرات في كل خريطة. وعرضت الدراسة الخطوات التطبيقية المستخدمة في إنتاج الخرائط الكمية في نظم المعلومات الجغرافية على خرائط السكان لمحافظة خميس مشيط، كما تناولت الدراسة حصر بمحتويات الخرائط وتقييمها وتحليلها وتصنيفها تنازلياً وفق ما تم إتاحته من بيانات إحصائية للباحثة. وبرزت مشكلة الدراسة في عدم إدراك الدور الحيوي لنظم المعلومات الجغرافية وبرامجها المختلفة في إنتاج الخرائط الكمية، وعزوف البعض عن استخدام وتفعيل أساليب التحليل المكاني على خرائط نظم المعلومات الجغرافية ومصادرها المتنوعة في تمثيل الظاهرات على الخرائط الكمية. وتوصلت الدراسة لأهمية الخرائط الكمية في نظم المعلومات الجغرافية وإمكانياتها العالية في إنتاج الخرائط والتعامل معها وتباين مجالات عرضها وسهولة تطبيقها بالرغم من افتقار بعضها لعدد من الأدوات البيانية التي يمكن تطبيقها في الطرق التقليدية وضرورة الربط بينها، قلة استخدام برامج نظم المعلومات الجغرافية بالرغم من أهميتها المعرفية ودورها في بناء الوعي المكاني وإمكانية التوسع في استخدامها، إضافة إلى ضرورة أن يكون مستخدم الخريطة ومتلقيها ذو مهارة عالية ووعي معرفي كافي لقراءة وتفسير مكونات الخرائط بالشكل صحيح ومحاكي للواقع واختتمت الدراسة بالنتائج والتوصيات. الكلمات المفتاحية: لخرائط الكمية – نظم المعلومات الجغرافية – طرق التمثيل الكارتوغرافي.